The Most Comprehensive Trading Platform and Community
A cutting-edge trading platform with an intuitive system and indicators. Designed by top quantitative engineers that have packaged it up into easy-to-use indicators, tools, alerts, and more. Giving regular traders the competitive edge they need
COMING SOON IN HOUSE FUND EVALUATIONS & PROP CHALLENGES-ASK FOR BETA ACCESS
WHO IS FLOW TRADE?
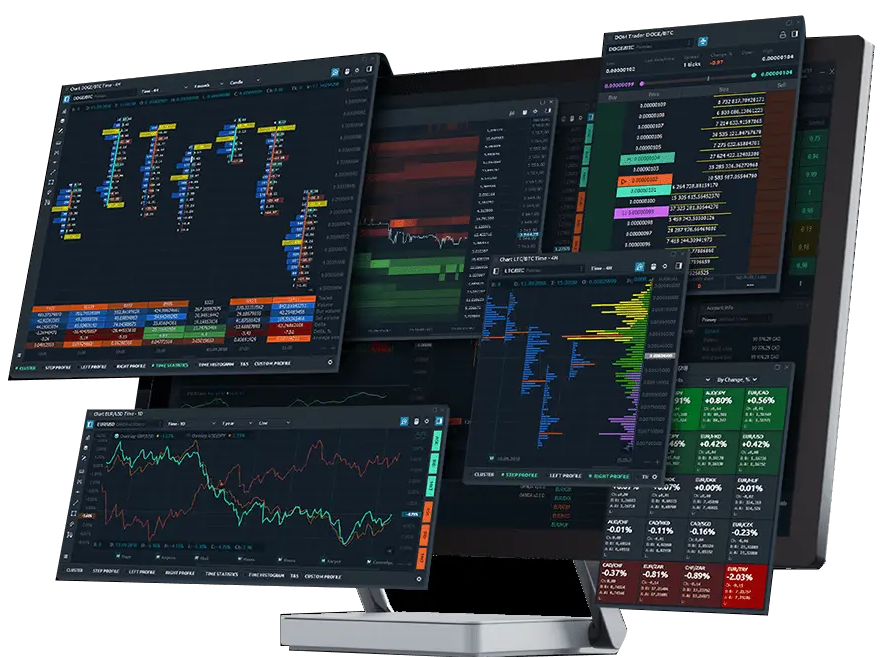
Flowtrade was created from the ground by a well versed group of traders. Fine-tuned to understand how trading works. Bringing many skills. Such as dark pool, quoting, order book processing, and building different algorithms. Some knowing vector machines, kernel ridge regression, mean revision and statistical arbitrage. Others versed in Index Rebalancing and sentiment Algo Trading Strategies. A couple with High-Frequency Trading (HFT) history but all with the same mind to find effective simplicity
We expanded our trade partners over time. Forming a community to help understand the market correctly. When we expanded from a trading career, to creating a product, our goal was to create tools anyone can use. Alongside various trading systems, anyone can learn. Also, bringing every tool needed under one roof. Come and see!
POWERFUL DATA ANALYTICS
AVAILABLE IN OUR
FLOW INDEX
TRACKING ALGOS
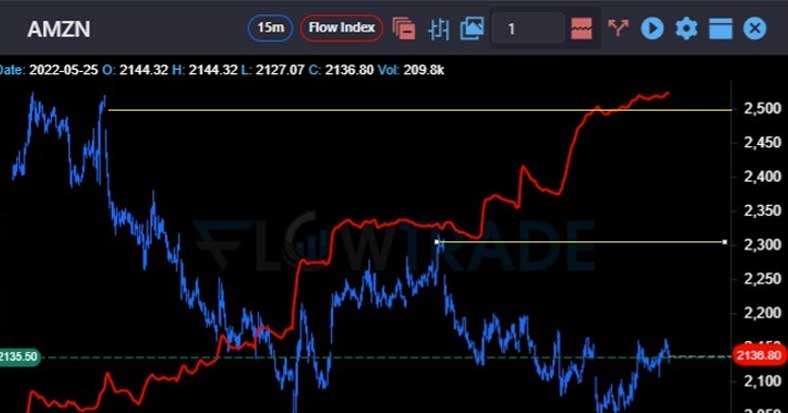
In a normal market, you would expect to see price and the FLOW INDEX rise and fall together, But when the FLOW INDEX has divergence from price, you see a major shift that will lead to a reversal in price. (alot of layers to unpack here, but the bottom line is that this is free money)
POSITIVE OR BULLISH DIVERGENCE
When the FLOW INDEX rises as the price falls, as shown here with AMZN, the condenser identifies buying into a low or support levels. The rise of the FLOW INDEX has identified accumulation into price weakness, "buying into the lows". This is called Positive Divergence and a reversal in price will follow.
NEGATIVE OR BEARISH DIVERGENCE
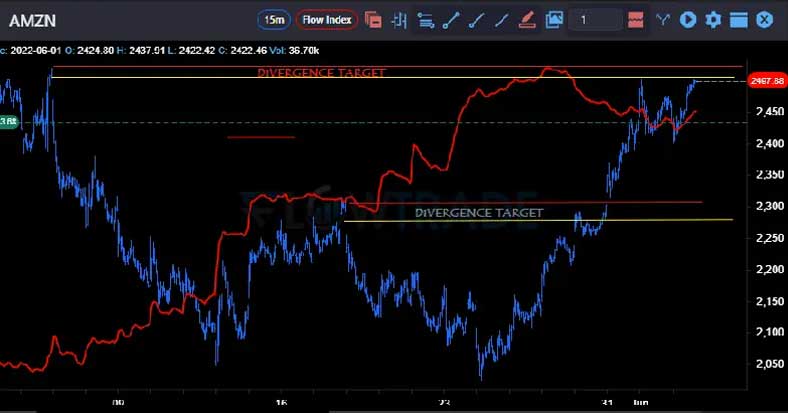
When the FLOW INDEX falls as price rises, as shown here, then it is identifying selling into a high or resistance level and is the opposite of positive divergence. you can see the red shading alerting the beginning of the divergence letting us know where price will return too. in this case its a 400 point move that we were well prepared for.
*THIS IS NOT AN UNCOMMON TRADE WITH A DISCLAIMER ABOUT RESULTS VARY ETC. THIS IS A COMMON TRADE THAT PAYS OUR TRADERS CONSISTENTLY
THE MOST POWERFUL INDICATORS AVAILABLE
FlOW INDEX
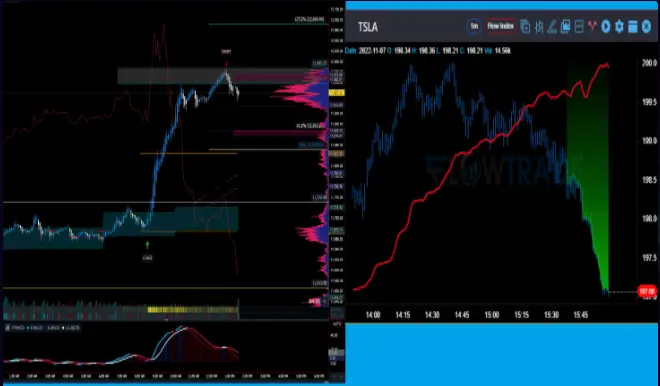
FLOW INDEX IS OUR FLAG SHIP INDICATOR THAT GIVES YOU A PEAK UNDERNEATH THE HOOD. RATHER THAN CHASING PRICE AROUND, YOU'LL BE ABLE TO SEE WHEN BIG MONEY IS BEING BOUGHT AND SOLD, COMPLETELY ELIMINATING ALL GUESSING.
NOW UPGRADED EDITION FLOW INDEX ALL-IN-ONE ON YOUR CHARTS OFFERS BETTER EXECUTION AND LESS MISTAKES!!
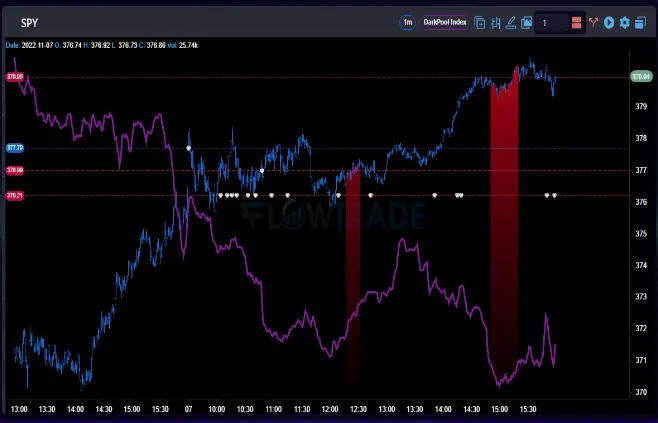
DARK POOL INDEX
THIS IS THE FASTEST SOURCE OF DATA FOR WHAT'S GOING ON WITHIN THE DARK EXCHANGE BECAUSE IT COMES STRAIGHT FROM THE EXCHANGE ITSELF. THESE ARE THE BIG PLAYERS DOING WHATEVER THEY WANT BEHIND CLOSED DOORS AND WE HAVE A SNEAK PEEK OF THE ACTION. SO WHETHER THEY'RE BUYING OR SELLING, WE KNOW THEIR SENTIMENT AND ALL THE MAJOR BLOCKS THAT COME THROUGH.
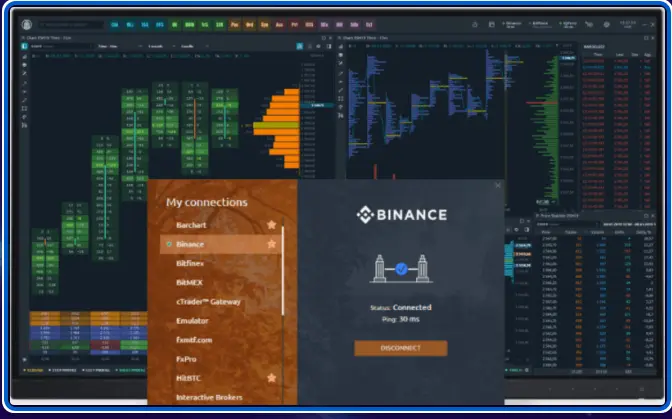
VARIOUS BROKERS, EXCHANGES & FEEDS
GET ACCESS TO REAL-TIME, DELAYED, AND HISTORICAL MARKET DATA FROM VAROUS EXCHANGES, MTF'S, BROKER AND DATA FEEDS. BROAD COVERAGE OF EXCHANGE AND CRYPTO CONNECTIONS ALLOWS YOU TO SEND TRADE ORDERS ACROSS MULTIPLE ASSET CLASSES.
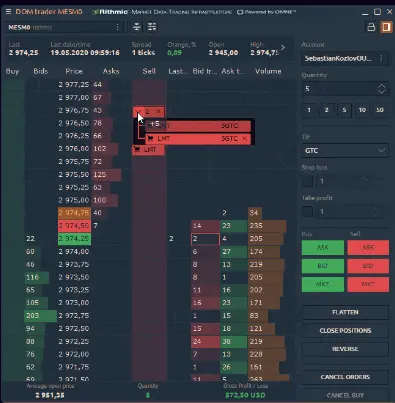
DOM/CHART Trading
CUSTOMIZE YOUR DOM TO FIT YOUR NEEDS. TRADE FUTURES CRYPTO EQUITES IN ANY MANNER YOU WANT STRAIGHT FROM THE DOM. TRADE SIMULATION AS WELL AS CHART TRADING AND COMPLEX ORDER ENTRY.
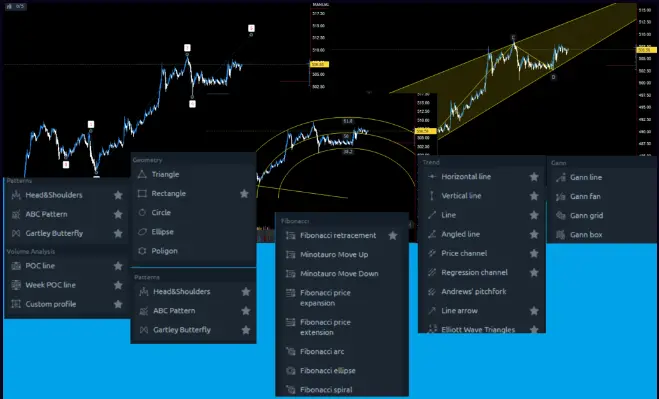
DRAWINGS AND INDICATORS
Trends & Channels
Geometry tools
Fibonacci & Gann
Harmonic patterns
Text & Comments
Channels
Moving Averages
Trends Volatility
Volume Oscillators
many many more…
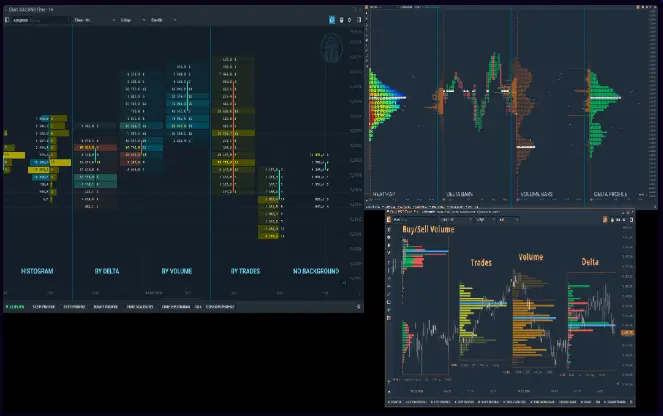
VOLUME TOOL BAR
VOLUME PROFILE TOOL BAR WITH EVERY STYLE FOR YOU CUSTOM NEEDS. FOOTPRINTS - STEP PROFILE - DELTA PROFILE -IMBALANCES -CLUSTERS - DOM HEAT MAP
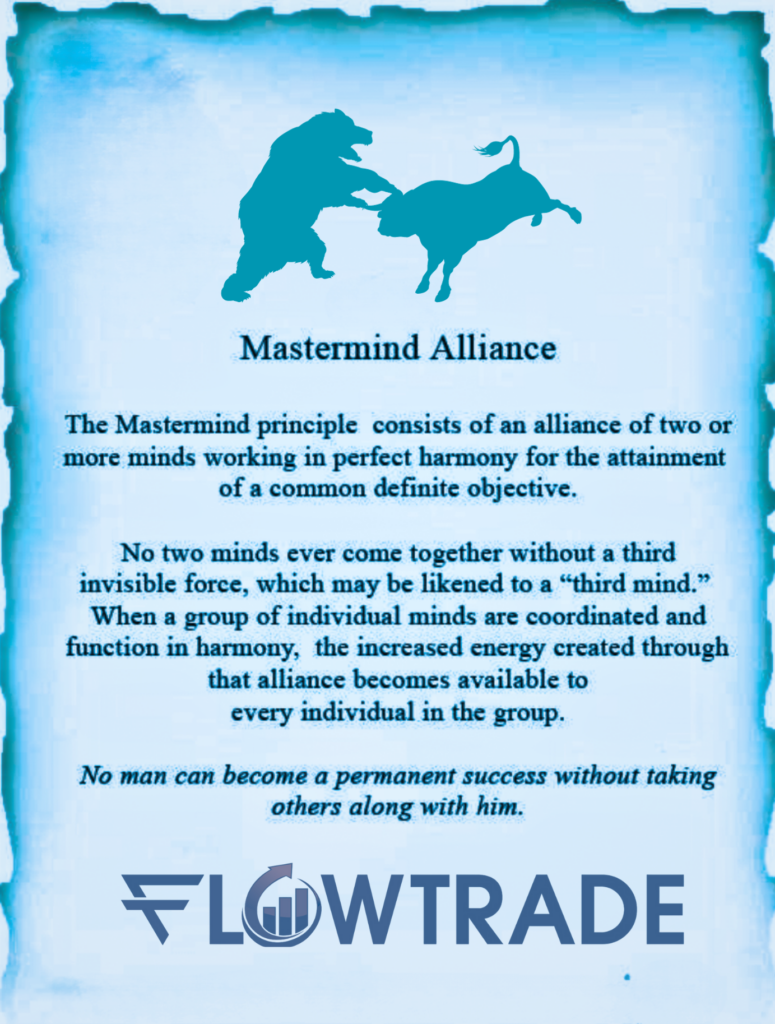
WORKING TOGETHER WITH VISION
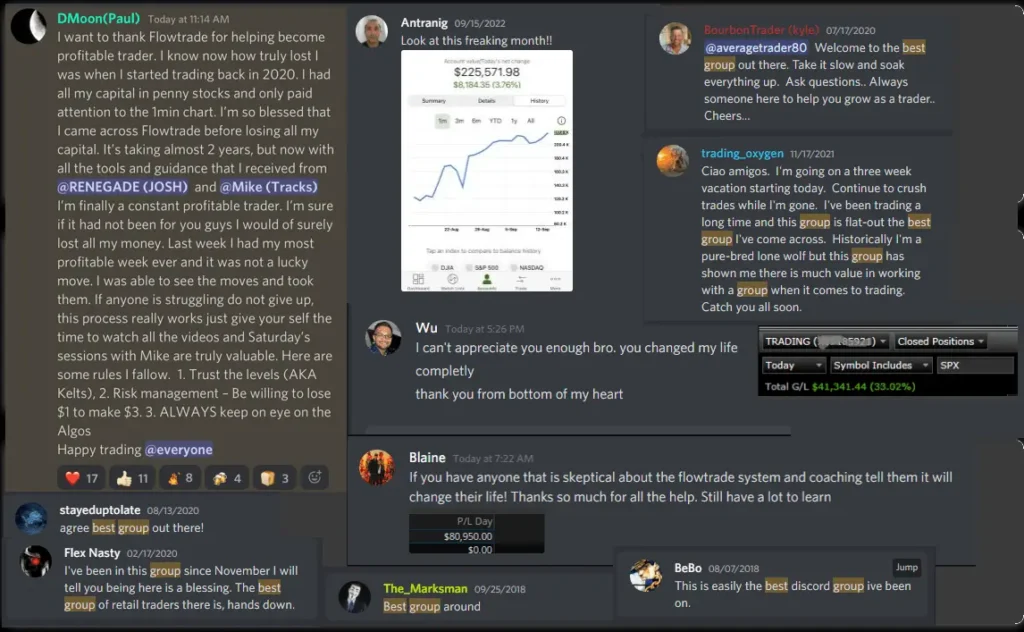
HEAR FROM WHAT OU USERS ARE SAYING IN OUR TRADE ROOM.
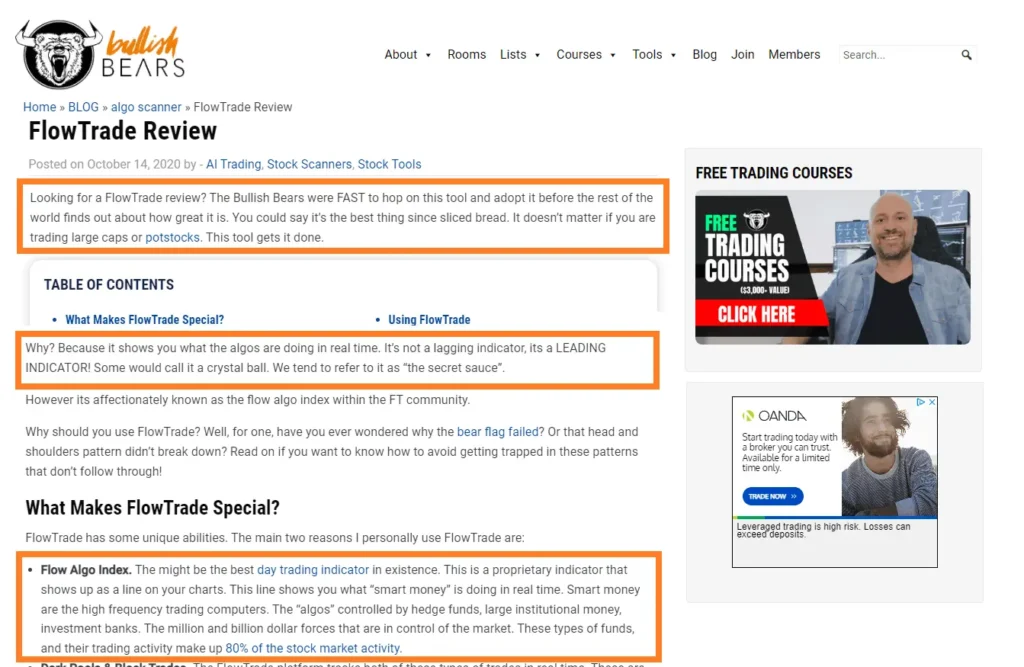
BULLISH BEARS REVIEW AND ITS
IMPORTANCE IN THEIR COMMUNITY.
WE WILL MAKE YOU A BETTER TRADER IN 30 DAYS!
WE WILL MAKE YOU A BETTER TRADER IN 30 DAYS OR YOUR MONEY BACK AND ITS FREE UNTIL WE SUCCEED SIGN UP FOR THE 7 DAY TRIAL GET YOUR PROFESSIONAL MENTOR THAT WILL GET YOU STARTED RIGHT!
